visitor@scotts-brain:~/memory-index$ cat infrastructure-first.md | less
Infrastructure Before Product
Most founders build their MVP first, then figure out production later. I'm doing it backwards.
- #infrastructure
- #engineering
- #observability
Most founders build their MVP first, then figure out production later. I'm doing it backwards.
I'm building DriftOS, a patent-pending conversational AI system that needs to maintain context across complex, branching conversations with sub-100ms latency. Before writing a single line of product code, I spent a couple of weeks building complete production infrastructure: Fastify, Prisma, Docker, Prometheus, Grafana, authentication, rate limiting, health checks, and automated dashboard generation.
If you're building a photo-sharing app, prototype fast and fix later. If you're building an AI context engine that must prove sub-second drift detection against IBM and Google, you start with infrastructure.
The Stakes
DriftOS has no margin for error:
I'm targeting enterprise customers who need proof, not promises. When you're filing patents on deterministic drift detection with hysteresis-based branching, you don't get to say "we'll instrument it later." The technical claims in those patents need to be validated with production data from day one, or they're just expensive paperwork.
DriftOS manages thousands of branching conversation lanes, each with their own semantic baselines, hysteresis counters, and drift vectors. If branches don't realign deterministically, an entire conversation graph corrupts itself. If I can't reproduce decisions across runs, the patents lose enforceability.
You can't debug sub-millisecond latency issues without proper observability, and you can't pitch Fortune 500 companies with toy metrics from a prototype that falls over at 100 requests per minute.
The "Efficiently Lazy" Philosophy
My design philosophy is simple: I'm efficiently lazy.
I started automating spreadsheets years ago because I was too lazy to copy-paste data manually. That laziness forced me to learn VBA, which led to Python, which led to building entire platforms. Being lazy in the right way makes you systematically solve problems once instead of fighting the same fire repeatedly.
Building production infrastructure first is the same philosophy. I'm too lazy to:
So instead, I built infrastructure that makes building products easier.
The Stack: Fastify + The Golden Orchestrator Pattern
The base stack is standard for modern Node.js:
But the novel piece is the Golden Orchestrator pattern that turns business logic into automatically observable pipelines.
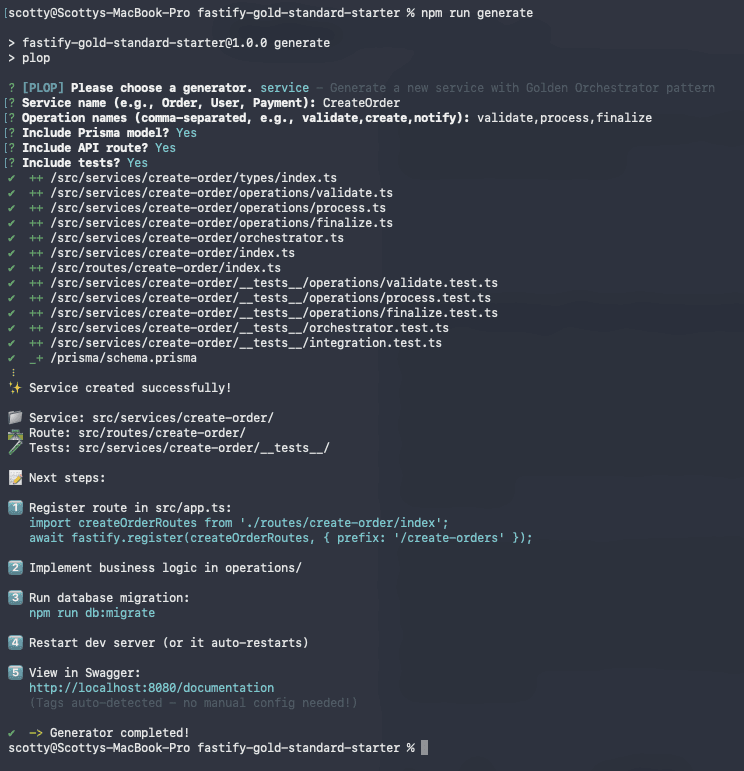
The CLI Generator
Instead of copying files, you run:
Select "Service", name it, specify operations. In 2 minutes you get:
Run npm run generate:dashboards and the new service gets its own Grafana dashboard automatically.
Auto-Generated API Documentation
Every endpoint you create automatically gets Swagger/OpenAPI documentation. No writing docs by hand, no docs falling out of sync with code.
TypeBox schemas define both runtime validation and API documentation in one place:
This single schema:
Visit /documentation and you get an interactive API explorer. Every route, every parameter, every response code - all generated from your TypeBox schemas. When you change the schema, the docs update automatically.
Load Testing That Respects Reality
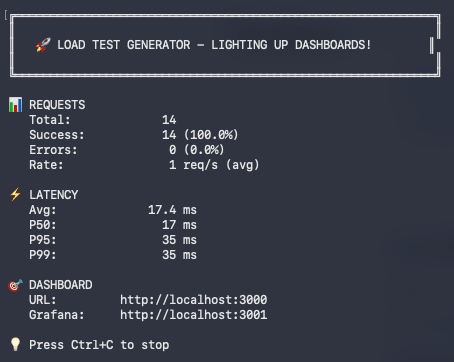
Most load testing scripts hammer APIs until something breaks. The included load tester is smarter: it respects your rate limits (100 req/min default), randomizes traffic with ±30% jitter to simulate real user patterns, authenticates automatically, and displays live stats (requests sent, latency, success rate).
Run npm run load-test in one terminal, watch your Grafana dashboards light up. Within 30 seconds you see which operations are slow, where errors cluster, and whether your system behaves under realistic load. No manual curl commands, no breaking your own rate limiter, no guessing at traffic patterns.
Auto-Generated Dashboards From Code
Every business operation follows the same pattern - a pipeline of discrete stages:
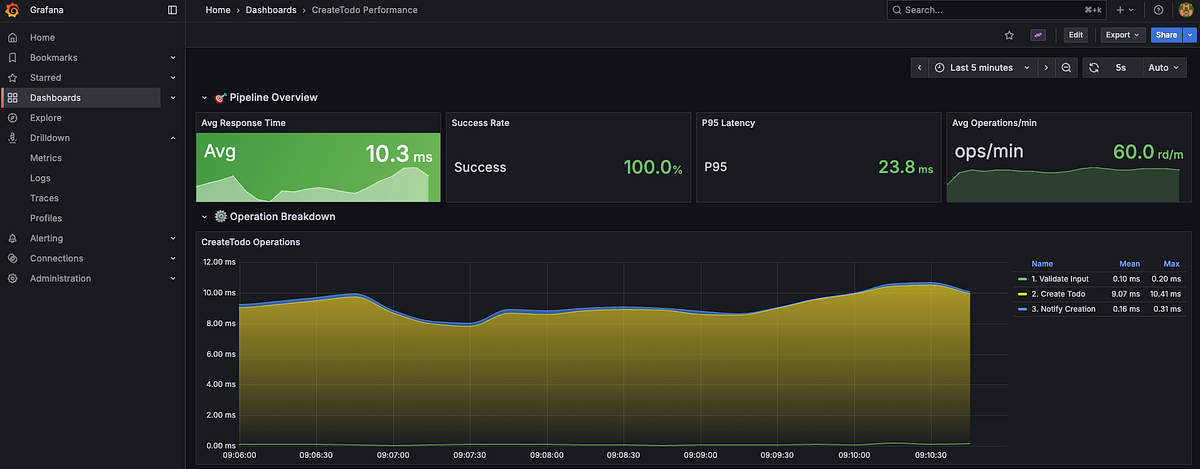
The orchestrator automatically instruments every stage. When you run the code, Prometheus collects total pipeline duration, individual stage latencies, success rates, and request counts.
Then the dashboard generator scans all orchestrators, extracts pipeline stages, and generates Grafana dashboards with:
What This Enables
Performance validation from the start
When I claim sub-1-second latency for semantic drift detection, I show actual p95 latency over 30 days. When investors ask "How do you know it scales?" I show request volume, error rates, and latency under load.
Informed architectural decisions
I refactored the semantic drift pipeline from single-pass to three-stage compression. Within minutes I could see: normalization (12ms), entity masking (45ms), embedding (180ms). Immediately obvious where to optimize.
Defensible technical claims
My patents describe specific performance characteristics. Those aren't hypothetical - I can show production metrics proving the system behaves as specified.
Open Source & What's Next
I've open-sourced the entire template: github.com/DriftOS/fastify-starter
It includes the orchestrator pattern, auto-dashboard generation, CLI generator, Docker setup, JWT auth, rate limiting, and load testing scripts.
I may be moving fast, but I'm never moving blind.